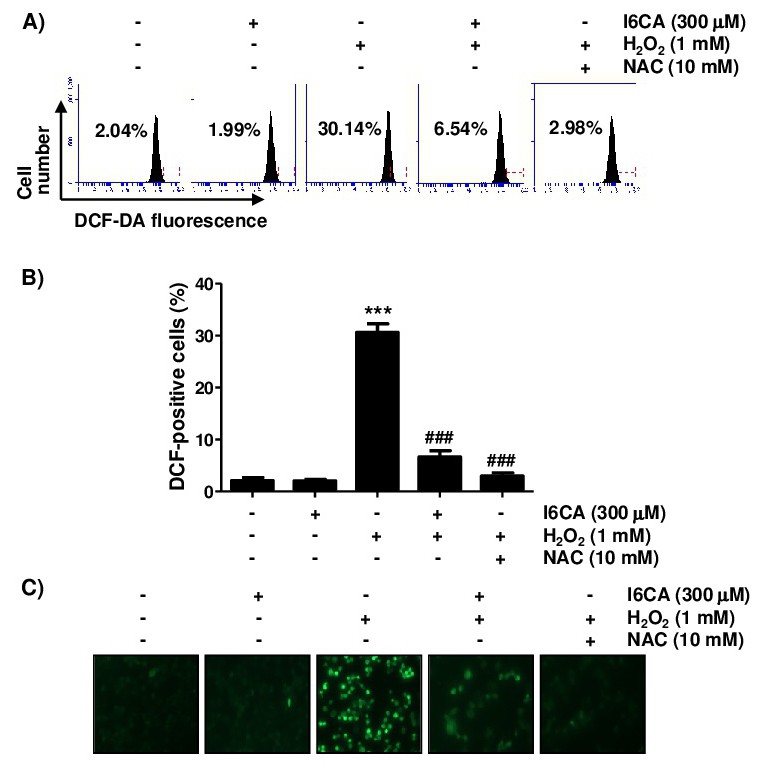
Fig. 2. Attenuation of H2O2-induced ROS generation by I6CA in V79-4 cells. The cells were pretreated with 300 μM I6CA or 10 mM NAC for 1 h and then stimulated with or without 1 mM H2O2 for an additional 1 h. The medium was removed, and the cells were incubated with medium containing DCF-DA for 30 min. (A) ROS production was measured using a flow cytometer, and representative profiles are shown. (B) The measurements were made in triplicate, and the values are expressed as the mean ± SD (***p<0.001 compared with the control group; ###p<0.001 compared with the H2O2-treated group). (C) DCF fluorescence images of cells cultured under the same conditions were captured by a phase-contrast microscope (original magnification, 200×). Each image is representative of at least three independent experiments.